Analyzing Superbowl Ads Trends Over The Years (with a bit of help from AI)
Table of Contents
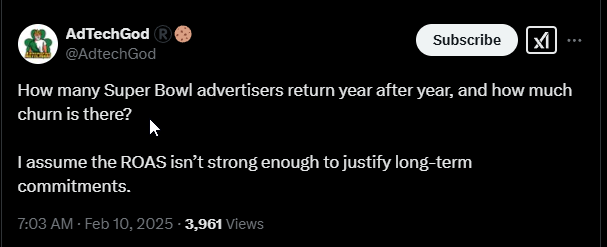
AdTechGod recently posted an interesting question on twitter “How many Super Bowl advertisers return year after year, and how much churn is there? I assume the ROAS isn’t strong enough to justify long term commitments.”
This got me thinking about the Super Bowl ads and how they have changed over the years, and I set out to do some analysis on it.
First steps#
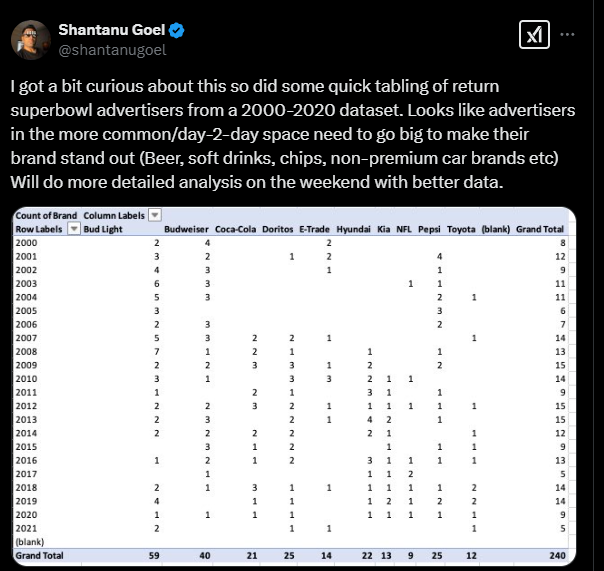
At the outset, I needed to get some information about the ads shown during Super Bowl in the past years. I found a few data sets which were fairly incomplete but a good starting point nonetheless, and I did a quick and dirty pivot table to get an initial insight.
https://x.com/shantanugoel/status/1889138261924434010
Preparing The Data#
Part 1#
I wanted to do a bit more though. The data I had was fairly limited, both in terms of information as well as the years it covered. So I wanted to create my own. I found superbowl-ads.com which seemed to be a pretty good source but of course they didn’t have an API or anything and needed scraping. It’s not too bad to write a scraper for a website like this, but it would have still taken me a few hours. So, I whipped out cursor.
I went through the site, created a model of:
- What things are needed to be scraped and what to avoid
- e.g. each year’s ads were linked to a page titled with that year number, the individual ad links were under a
cactus-post-itemdiv, the sidebarcactus-sidebarhad additional/unrelated ads and thus needed to be ignored, and so on.
- e.g. each year’s ads were linked to a page titled with that year number, the individual ad links were under a
- What format are the ads titled in that I could parse to decompose into the data I need to take out brand name, ad title, etc.
- There were quite a few. And a few variations on each. So I had to list down various such formats in which they appear
- What information I needed to take out from each ad
- Brand name, Ad title, year at a minimum. Which could be taken out from the above things
- I also wanted to get more information about the ads itself though like themes of the ads, what kind of industry/product they were advertising, etc. So I thought of collecting the video url as well.
- I needed to select a data format in which I should save this data. I had a few options that I thought about: csv, json, sqlite, etc and I went with json, mainly because they are human readable, so I can easily look at and update info if needed. CSVs could do this too, but they are much less structured and post processing often becomes a pain where the delimiter is also used in the content itself.
With this, I could give a good extensive prompt to cursor to create a scraper in python that could get this data in place for me. It needed a few iterations back and forth to fix a few issues (runtime errors, broken links, more format issues, etc) but in 30 minutes or so I got it to work, and collected data in the below looking format
  {
    "year": "2025",
    "brand": "GODADDY",
    "title": "“Social Slickness”",
    "original_title": "GoDaddy Super Bowl LIX 2025 Ad “Social Slickness”",
    "page_url": "https://www.superbowl-ads.com/godaddy-super-bowl-lix-2025-ad-social-slickness/",
    "video_url": "https://www.youtube.com/embed/K2Gj9BufAqo?feature=oembed&autoplay=1&wmode=opaque&rel=0&showinfo=0&iv_load_policy=3&modestbranding=0",
    "description": ""
  },
Part 2#
Next, I wanted to augment this data with some more information that was about the ad content itself, rather than just the brands/industry. I could go through each one of them myself like a psycho, and spend weeks compiling this information. But WHO DOES THAT NOW? So, I got the good old Google Gemini AI into action. I got cursor to create a data enhancer script that:
- Takes the json output from above
- Sends each youtube URL to Gemini AI
- Gets back things like:
- A 100 word summary of the ad itself
- A category representing the product/industry being advertised
- A list of keywords/tags that describe the themes used in the ad
- I also had to make sure that the categories/themes pick from a specific list of things rather than being completely left up to Gemini so that I can actually do aggregation/analysis of them.
With this, I was able to convert the above data into something like below:
{
    "year": "2025",
    "brand": "GODADDY",
    "title": "“Social Slickness”",
    "original_title": "GoDaddy Super Bowl LIX 2025 Ad “Social Slickness”",
    "page_url": "https://www.superbowl-ads.com/godaddy-super-bowl-lix-2025-ad-social-slickness/",
    "video_url": "https://www.youtube.com/embed/K2Gj9BufAqo?feature=oembed&autoplay=1&wmode=opaque&rel=0&showinfo=0&iv_load_policy=3&modestbranding=0",
    "description": "The GoDaddy Super Bowl LIX ad \"Social Slickness\" features a series of short vignettes showcasing how people use GoDaddy's website builder to create their own online presence.  It highlights the ease of use and the diverse range of businesses and individuals using the platform.  Quick cuts showcase different websites, from a dog groomer to a musician, emphasizing the accessibility and user-friendly nature of GoDaddy's website building tools.  The overall tone is upbeat and emphasizes empowerment and small business success.",
    "category": "Technology",
    "theme_tags": [
      "Humor",
      "Social Message",
      "Celebrity"
    ]
  },
Part 3#
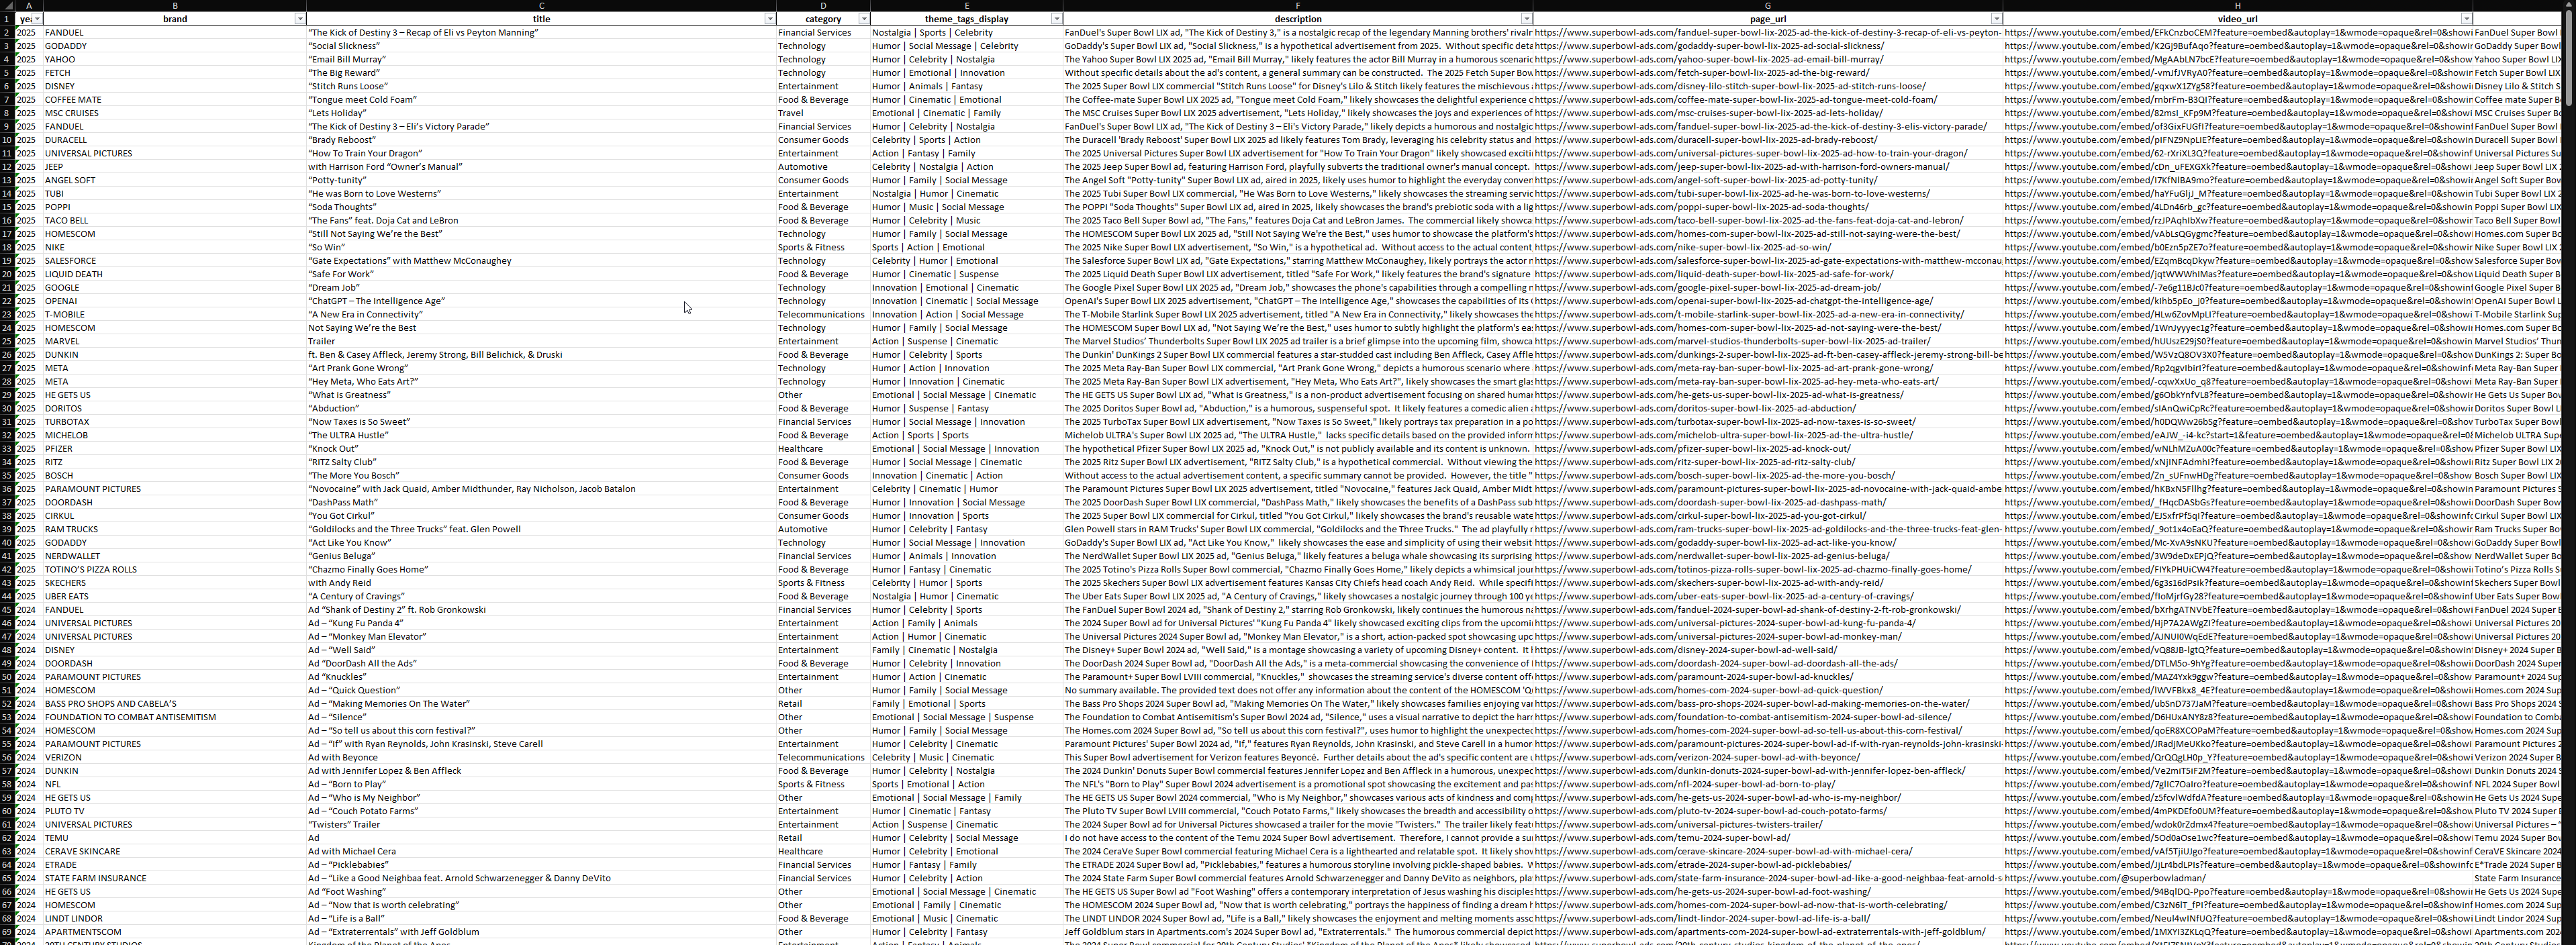
With this hand, I had a pretty malleable form of data that I could work with. Now, everyone knows that the easiest way to play around with data is plain old Microsoft Excel. So I got cursor to write another script yet again :D, this time to convert the json data into an excel sheet. I also got it to convert the themes into a one-hot encoding type scheme so it becomes easier to do pivot tables on them.
I also had to do a lot of clean up manually, especially around brand names, because scraping is scraping and is marred by human errors in the original data as well as not being able to cover each and every edge case. There’s also some data missing (particularly from year 2017) but I think this doesn’t create much of an issue for the overall analysis.
With all this, I had the data looking like below:
Analysis & Insights#
We’re into the juicy parts now :D
Categories/Industries#
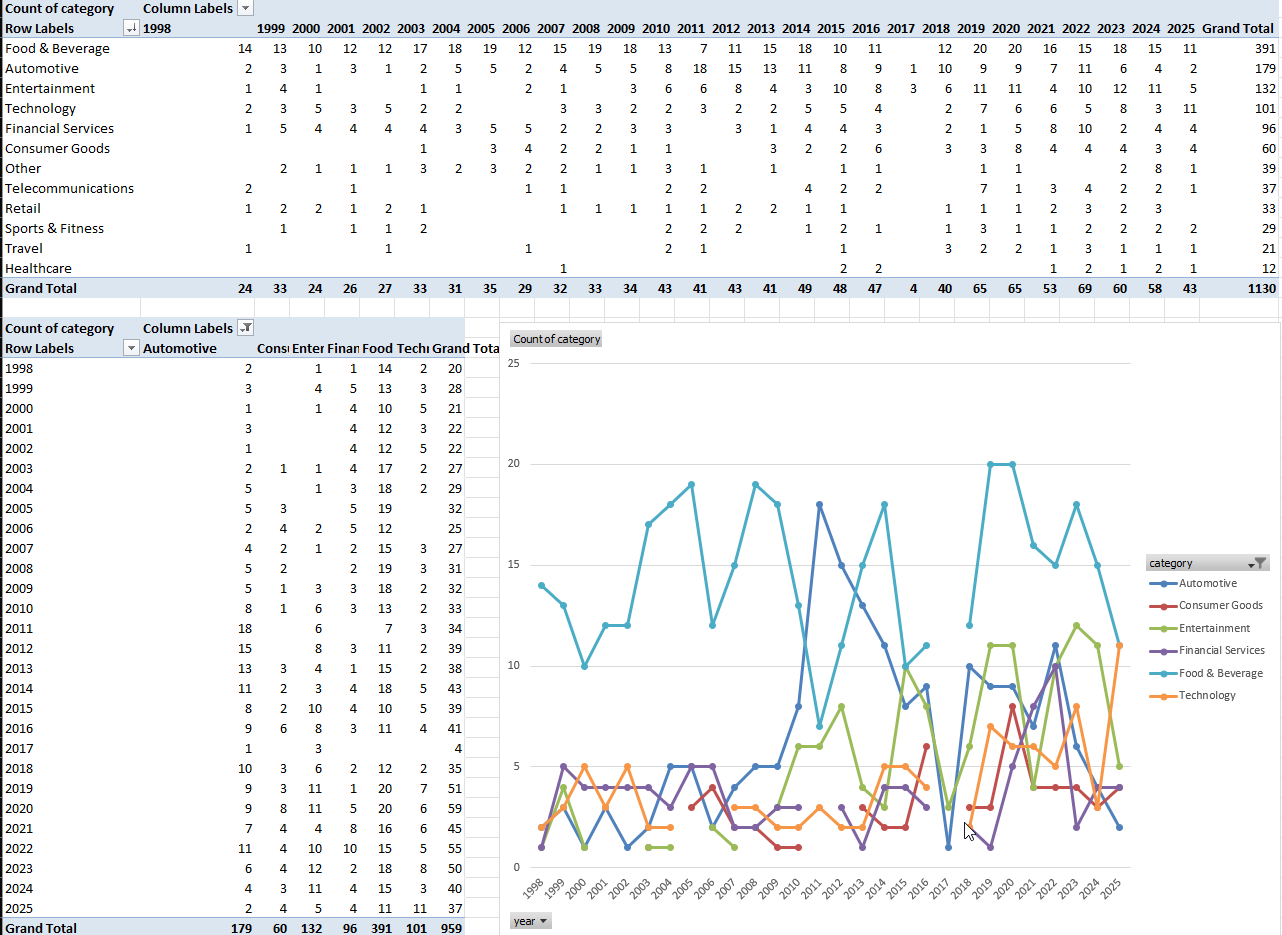
First thing I did was to break down this data per the industry, and there were quite a few curious things that came out:
- Food & Beverages (Mostly beverages though) and Automotive are the biggest sectors in Super Bowl Ads
- Ironically, Sports & Fitness sector is one of the least represented, in one of the biggest sporting events
- Automotive and Entertainment started rising in representation after 2011. Probably signals recovery spending after the 2008 crash?
- Financial services had a big jump in 2021/2022. Probably playing on post-covid sentiment on the need to invest/save more?
- Automotive seems to be slowing down now in the past few years
Themes#
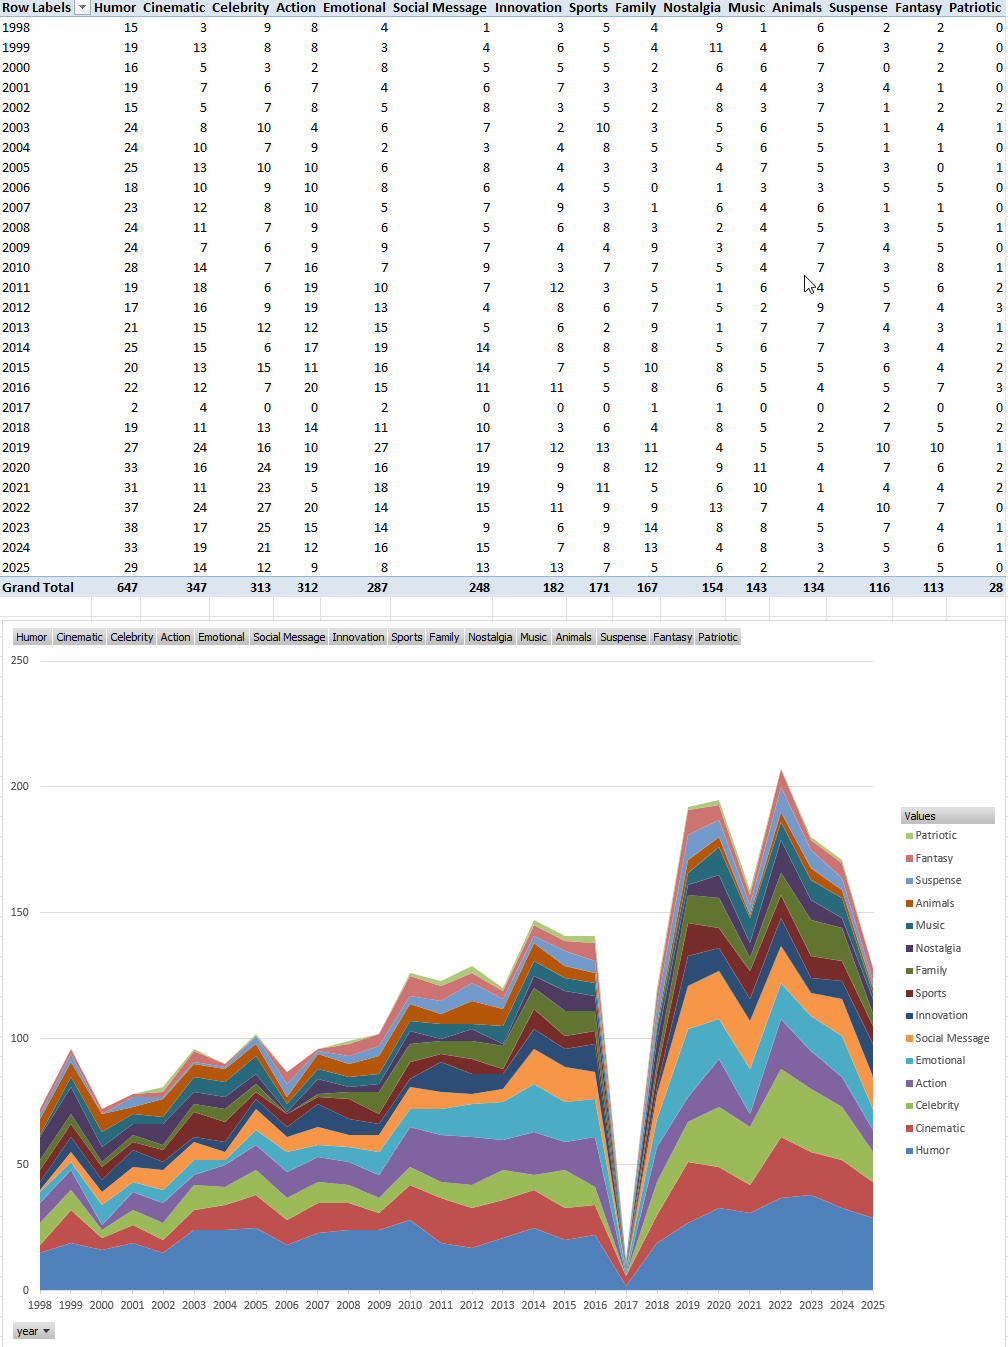
I also wanted to understand the kind of themes that the ads played on.
- No surprises in the top themes. We all love and remember the funny ads from the past super bowls, and Humor does indeed take the top spot, by a huge margin
- I wanted to see if Patriotism has become more common theme in the last few years with all the politics and the nationalism waves going around, but doesn’t seem like so
- Going big if you are spending so much makes sense, so Cinmeatic themes, using Celebrities and Action turned out to be pretty big as well, with ** Emotional** themes not being far behind
- For some reason, Family theme has picked up in the last 7-8 years though traditionally it didn’t used to be so much used
- Social Message themes are becoming more popular as well over the last 10 years.
Brands#
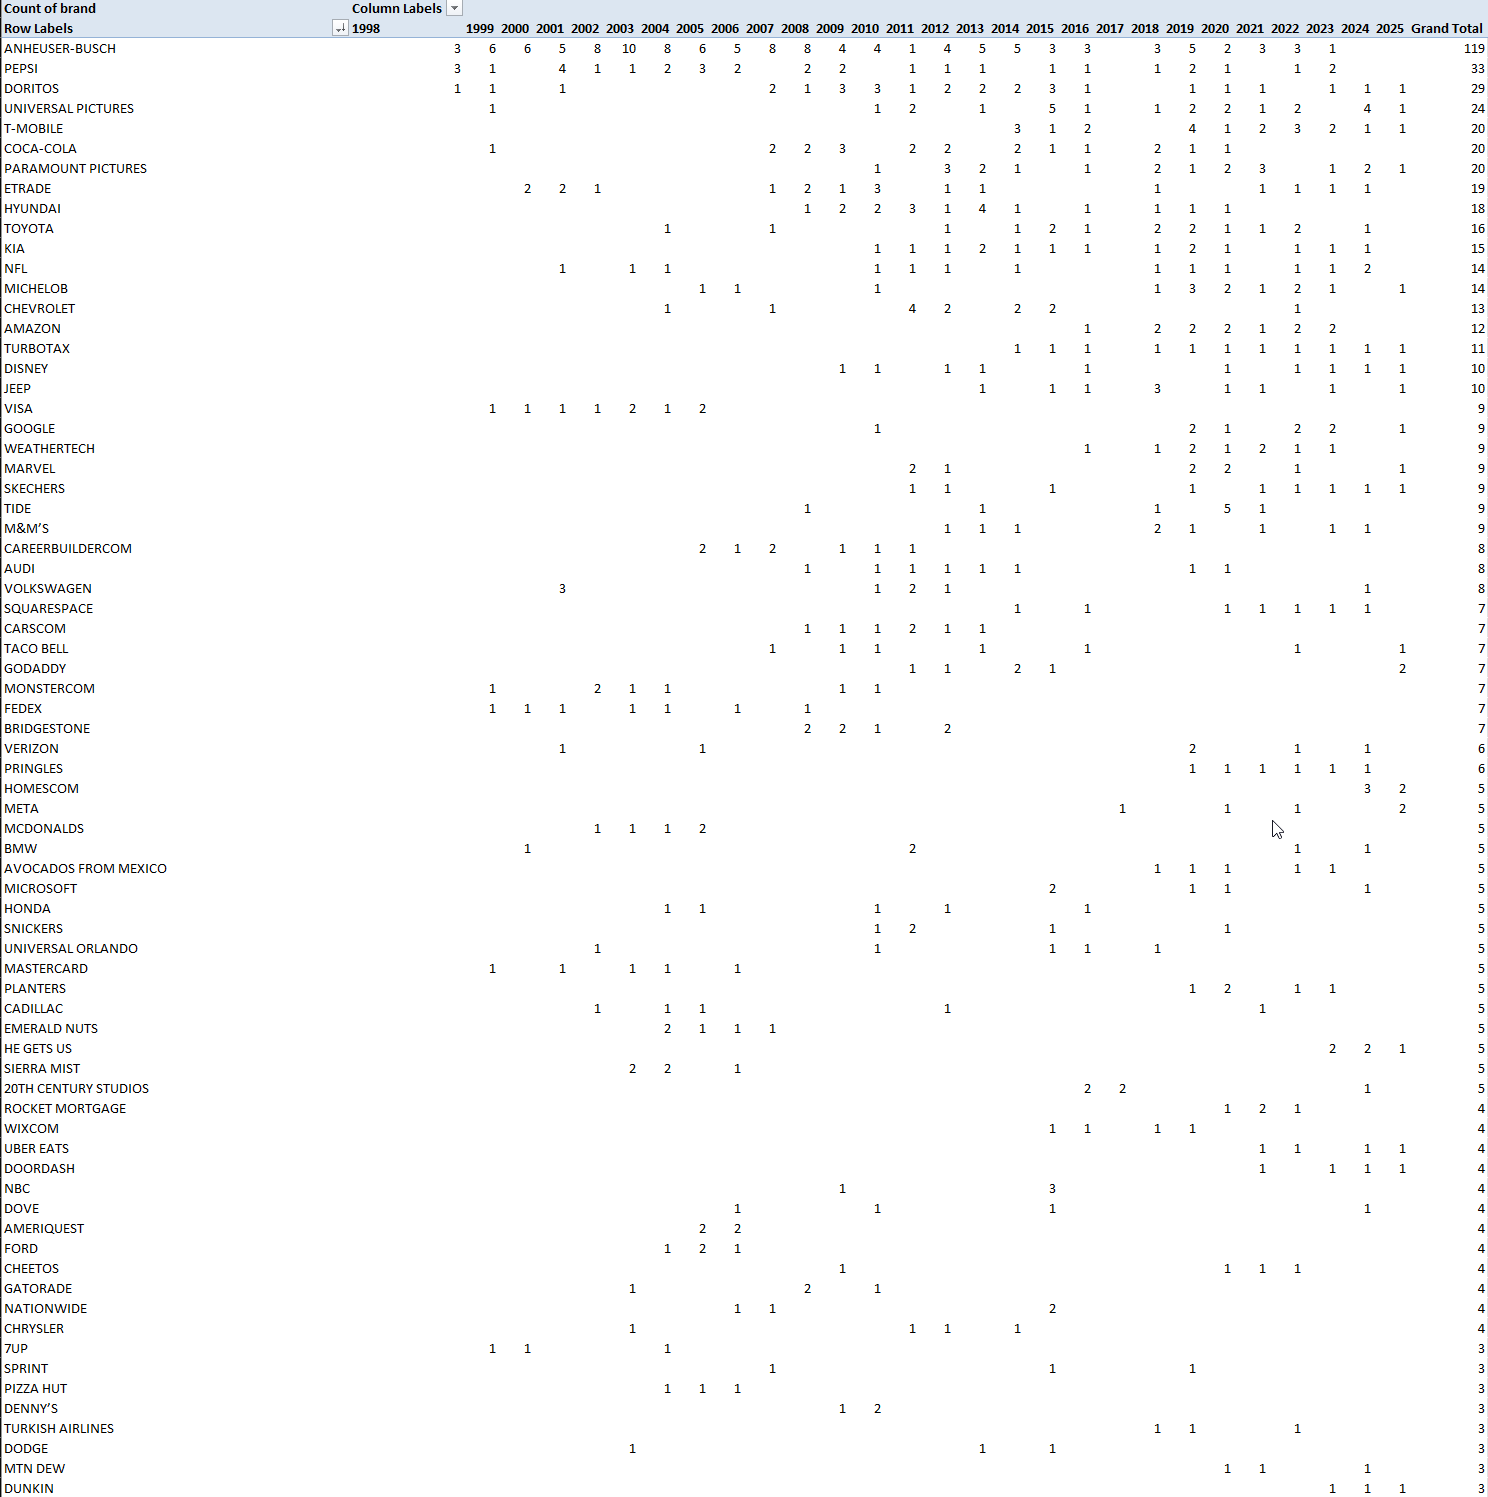
Finally we come to the part which started it all, the brands.
- Anheuser-Busch (Bud light/ Budweiser etc) is the largest spender. Leading the pack year after year, although they’ve slowed down a bit compared to the early 2000s
- Pepsi/Coke/Doritos (Soft drinks/snack providers) follow as a distant second. Pepsi seems to outspend Coke by more than 2x in Super Bowl considering Dorritos is their sub brand as well (There are a few other sub brands for both Coke and Pepsi as well in the list)
- It’s interesting to note that while there are occasional other snacks/soft drinks/beer brands that show up, but 3 of these brands (Anheuser-Busch, Pepsi and Coke outspend every other player by far)
- My thought process around these taking the top spot in advertiser list is that they probably want to associate drinking/snacking with the game time and use this as the right time to hit home to make people associate their brand as being synonymous with watching sports
- This is followed by movies/series etc ads which is expected to promote big budget content
- ETrade seems to be the sort of lone star in terms fo financial services brands coming back year after year
- Amongst the automotive brands, which is the second largest overall sector, more common ones seem to be the non-premium brands like Hyundai/Toyota/Kia etc which take up the most space. I guess they need to spend big to make their recall better in a crowded market with not much differentiation in the product
- Amongst the tech companies, Amazon shows most ads, but that includes their prime video content too. Other than that Google is most common. Square space showing up here is a bit surprising but they’ve been spending every year since last few years.
- Biggest surprise, YAHOO! of all people had an ad in 2024 out of the blue with Bill Murray, promoting their email services lol.